Imagine you are working on an issue in an existing feature. You started on Monday by reproducing the issue, you went into the weeds of the legacy code for the feature & you finally found the issue. Just by plain old code reading. It’s Thursday evening & you feel accomplished. You spent the next few hours into coding the fix, add tests & then send the code change for review. Even though its well-past your working hours, you are charged up by the dopamine rush of closing the loop on the critical bug.
Next morning when you wake up, you see that your code change has been approved & the reviewers are pretty impressed by the fix. You smile & merge the code change while sipping your morning coffee. Even though your workday has not yet started, you sit there while seeing your fix moving through various stages of the deployment. Suddenly you get distracted by sudden noise in a Slack channel about customers witnessing degraded app experience.
A dread of sweat comes over you. Is this because of your fix? Should you prepare a revert PR? How can you confidently say that the drop in performance is not being caused by your fix but by some other downstream service?

If the only data point your service provides is how long a particular request takes then you have no choice aside from reverting your PR. Just revert your change & pray that it solves the issue. But if you have set up some good observability into your application, then you can jump into the war-room with concrete data points. You can make a case that it was not your code change that caused the slow down while also pointing towards the actual cause of performance degradation. You gain two things from having correct observability into your application:
- Your developer productivity is not impacted as you don’t have to revert your code change just to remove yourself from the suspect lineup
- Overall time to resolution for the issue is also reduced as you work towards the right direction to solve the issue
Consider your service which for each request performs a write to a database, updates a cache & calls a downstream service. So essentially each request consists of these 3 operations. In order to calculate the total time for the request, you will need to first figure the order in which the 3 operations are applied. Are they performed in parallel or do they depend upon each other in which case it will be sequential order? What if the external service call happens first followed by the database & cache write happening in parallel. In order to troubleshoot degradation of the service response time, you will have to first figure out which operation is contributing to the delay. Let’s assume that it is the external service call that is showing abnormal latency but that external service is also owned by your team. You essentially need to dive into the internal operations that the external service is performing. You need the same data points from the external service too.
This is why we will try to understand what are the primitives of observability which form the common terminology of the observability ecosystem. In upcoming posts, we will also see how to implement it in your application using various tools from the observability stack.

Trace
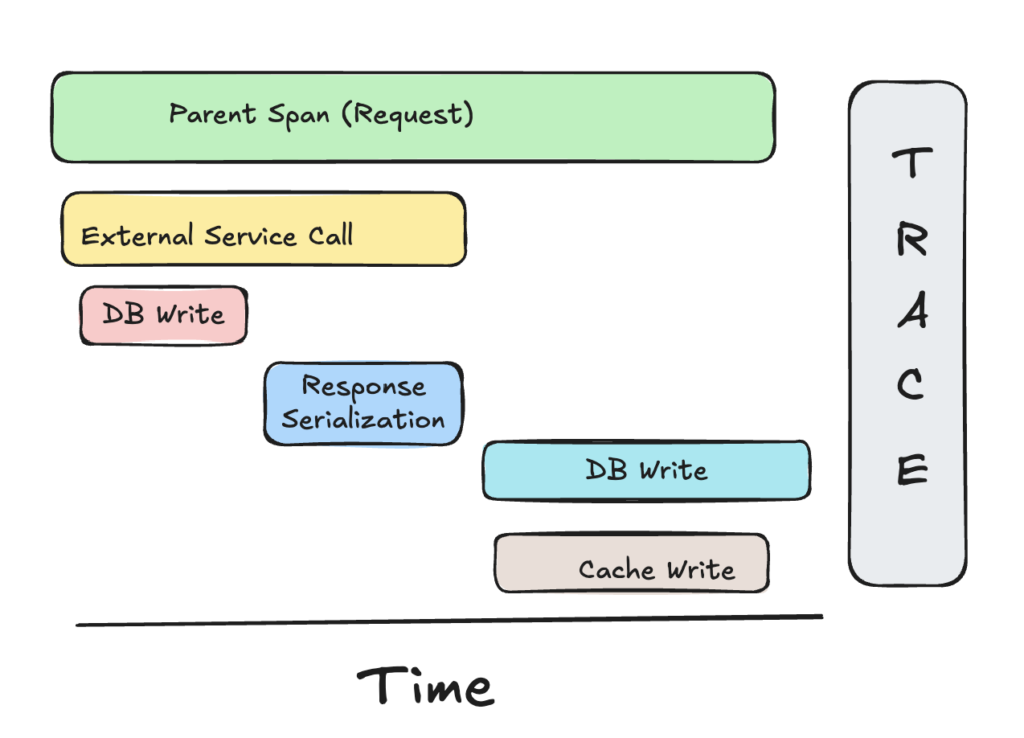
A trace shows the complete journey of the request in an application. It is not limited to a service & commonly crosses service boundaries. So in our example, a single trace id will be attached to the request. The trace id will be used to identify a request when it crosses multiple service boundaries. The trace id is propagated across services & allows you to build a path which a request takes from start to the end. In the above diagram, all the operations have a common trace id attached to them which is propagated across multiple services.
Span
Span is the most fundamental block of a trace & it represents a single unit of work. Work can be described something as simple as publishing a message to a queue to as complex as calling another service endpoint which can split further into multiple spans. Each span has an associated span id & a parent span id. So in above diagram, the span for database write operation will have a parent span id of the external service call. Span also has bunch of attributes such as status code, http method, start time etc.
With this parent-child relationship across spans along with the common key of trace id tying them together, you can form the logical flow of request across various operations. Now with the observability in-place, you can easily point out which operation is contributing to the increased latency.
Now that you have become familiar with this common terminology, as part of upcoming posts we will start diving into the industry standard tooling that helps you in instrumenting this observability in your application & leveraging it to troubleshoot issues within it. Happy learning!
