

In the last post, we touched upon the requirement for observability & understood the basic components that form the common terminologies of the observability stack. In this post, we will take a look at monitoring which is one of the areas of observability used for proactively observing your system. It is also used along with alerting to alert someone(usually an on-call engineer) if things don’t go as per the expectation.
Setting the stage
Let us consider our demo application that performs the functionality of booking. Its a simple application serving only one endpoint to reserve a booking. In order to do so it calls an external service to first generate a booking id. Then it persists the booking record in the database & returns a successful response to the client. For external service, I have used an API from https://httpbin.org. You can view the application code for the booking service here. It is a SpringBoot application using Postgres as the database.

Now with this service in place, how would you ensure that it is operating correctly in production? Think of things that can go wrong:
- Request itself can start failing due to failure in either external service or database
- A recent code change could introduce a memory leak eating away the memory
- As it is a Spring application, you will need to monitor the heap usage & other metrics around JVM
- CPU utilization & a bunch of other things
Having clear visibility around such metrics will help you in reacting in the right direction when things go wrong. A much better scenario would be where you are either alerted before the actual issue starts or some form of action is triggered to bring back the system in an ideal state such as auto-scaling. But a pre-requisite to having all this is a bird’s eye view of your application health.
Setting up monitoring
This is where monitoring comes into play. Most of the mainstream frameworks provide good support for setting up observability in your application. In the Spring framework ecosystem, this is done through actuator. Setting up monitoring consists of following key areas:
- Emitting metrics from the application
- Collecting metrics
- Visualizing the metrics in a clear format
So in our case actuator takes up the responsibility of emitting the metrics. We make use of Prometheus to collect/scrape these metrics & make use of Grafana to visualize these metrics.

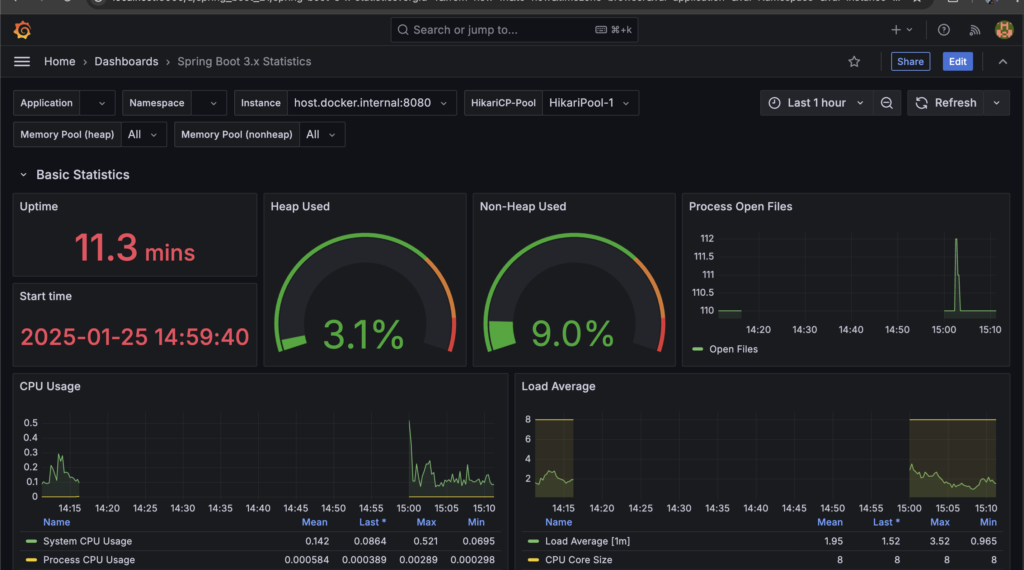
Our booking service exposes these metrics through actuator endpoints while Prometheus is configured to scrape these metrics & store it in a time-series database(TSDB). Grafana uses Prometheus as a datasource & now you can use it for building dashboards for monitoring. You can also perform ad-hoc queries using PromQL to perform exploratory analysis. Grafana also provides template dashboards that you can use for your application in the beginning & then modify it as per your requirements. Here is an example of dashboard built using the Grafana’s SpringBoot template.
You can view the code for integrating booking service with Prometheus & Grafana here
Digging deeper
Now that you have application level monitoring in place, do you think you have all the information you need? Let us think about a scenario where your service endpoint is used by an upstream service & that service starts seeing increased latencies for certain set of requests. Can you use the existing infrastructure to troubleshoot this?
Well with the existing observability stack, you are already recording the total time it takes for a request. But is that enough? We know that our request is not atomic but rather it performs 2 different operations. With the current data, you can just confirm that the issue is actually happening due to your service but you cannot pin-point to either the external service or the database operation as the culprit of increased latency.
We will try to solve this problem here by instrumenting more detailed metrics. We need request level metrics on a more granular level. We do this by first distinguishing one request from another by assigning them a request id. In Spring world this is done by adding an interceptor to your service endpoint. Now this request id is propagated to the layers that process the request & we can record time for the complete request as well the individual operations. You can view all the code for this instrumentation here.
All these metrics now are picked up by Prometheus & we can figure out which operation is resulting in increased latency. Lets go through this exercise. We first list down total time for all requests.
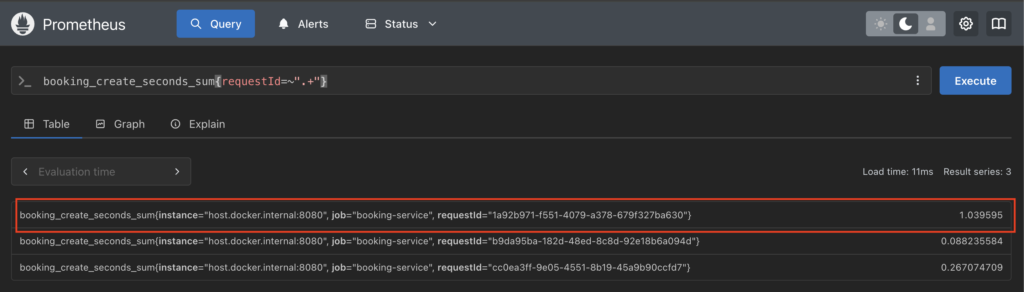
We get an outlier request with higher latency. Next we narrow down the request time for individual operations for this one request.
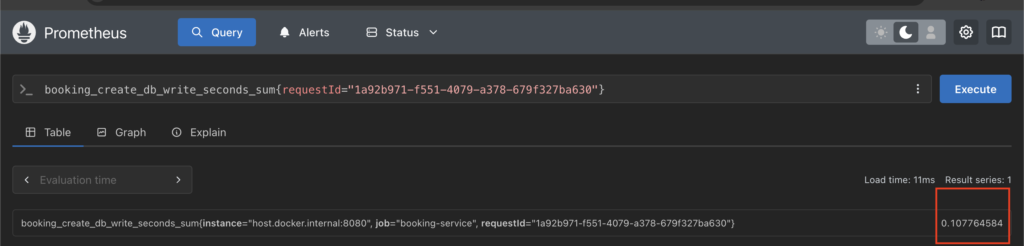
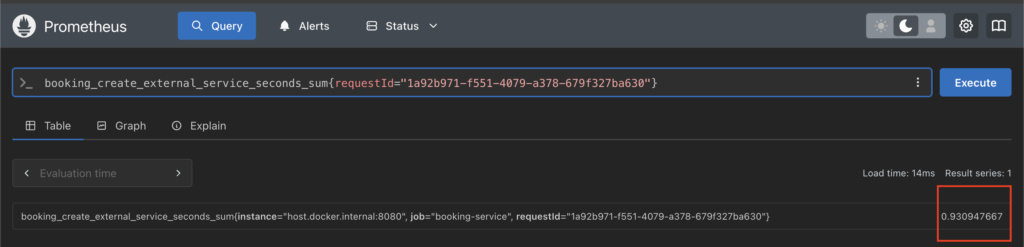
Now that we have the individual operation level metrics, we can benchmark them against the time taken in case of other requests & then come up to a conclusion of whether it is the database operation or the external service which is contributing to increased latencies.
The complete picture
Let us assume that it was the external service which was contributing to increased latencies. Do we start the same exercise with the next service? What if the external service doesn’t have the same instrumentation? Even if they do have it, how are you going to tie the request in your system to those in the external service. You need some connection between the request leaving your application & landing in the external service.
This is the point where we hit limitations of monitoring while trying to answer specifics of a single request. Monitoring is about a system. What we are trying to achieve is tracing. Instead of being about a service, tracing is about a specific operation. It provides an in-depth view instead of a bird’s eye view & it requires all the components interacting with the request to be instrumented.
Does that mean you don’t need monitoring? Nope. Not at all. Monitoring serves a different need altogether. Think of this way. You will get paged either through an automated alert or manually after something has gone wrong(or is about to go wrong) in the service. This is achieved by monitoring. Monitoring will allow you to point in the right direction for the issue you are troubleshooting. Whereas tracing allows you to go into the nitty-gritty details to find the actual problem. So any good observability system will need to have both monitoring & tracing. This will make life easier for service owners & will decrease the TTR(time to resolution) when your service encounters an issue.
We will dive into the various technologies that you can use for instrumenting tracing in your system as part of the next post. Happy learning.