

In the last post, we explored how we can leverage tools such as Prometheus & Grafana for monitoring our applications. We also discussed about the limitations of monitoring & how tracing can help us recover from the limitations of monitoring. But before moving on to tracing, let us first discuss about an obvious problem in our existing observability infrastructure.

Our observability stack currently consists of Prometheus & Grafana. We will add more components when we will integrate tracing in our infrastructure. Now consider a typical microservice architecture with a bunch of microservices along with a deployment for our observability stack upon which all our microservices depend upon. Now your team decides that we don’t want to use Prometheus but rather use InfluxDB in place of it. With the above infrastructure, you will have to first add component for InfluxDB & integrate it with Grafana. Then you will have to update all the microservices to reflect this integration change to work with InfluxDB. In case of SpringBoot application, this change will be disabling prometheus endpoint for actuator & exposing another endpoint for pushing metrics to InfluxDB. These changes will be required for all the microservices in order to have correct instrumentation. There can also be changes in the format of metrics & will result in a much more complex & riskier integration.
This is a lot of work & also a risky change while your application is handling production traffic. Also this change will be done every time you change something in your observability stack which might even discourage your team to continue working with older tools instead of leveraging new tooling in the observability space.
OpenTelemetry: One broker to rule them all
OpenTelemetry is a vendor neutral & open-sourced set of standards & tools that integrate well with majority of tooling in the observability ecosystem. Don’t mistake it with a metrics framework or a time-series database such as Prometheus. Rather it is a set of common formats for other tools to integrate with along with a set of API SDKs & libraries for applications to integrate with. Consider this as a standard protocol for Observability which other tools understand & implement so that everyone can interact with a common dialect.
OpenTelemetry project came as part of merger of another two open source projects OpenCensus(For metrics) & OpenTracing(For traces). It acts as a standard for both metrics & tracing in the observability ecosystem. You can read more about its history here.
With OpenTelemetry in place, your microservice now only needs to push metrics to OpenTelemetry while other tools of the ecosystem interact with OpenTelemetry directly. So now when you want to switch from Prometheus to InfluxDB, the only change you need to make is in your observability stack while the microservices continue making use of OpenTelemetry & hence remain unchanged. Our updated architecture looks like below:
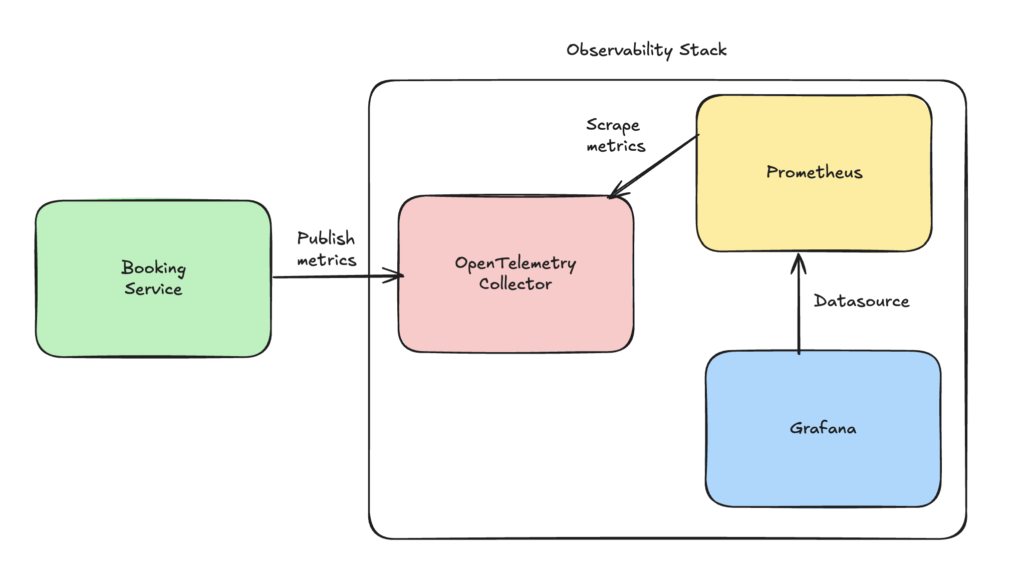
We have an OpenTelemetry collector(OTEL collector for short) where our application publishes the metrics while other tools such as Prometheus use these metrics in either push or pull mechanism. In Java world, you can achieve this by integrating with micrometer-registry-otlp library to export metrics to OTEL collector. I have also updated the booking service from previous post to use OpenTelemetry & you can view the updated code here.
Now that we have a brief overview of OpenTelemetry, we will dive into solving the tracing issue we saw earlier by exploring new tools from observability stack. Happy learning.