

“Observability is the lens through which the invisible becomes visible, turning complex systems into understandable narratives.“
So before taking a detour to understand the role OpenTelemetry plays in observability ecosystem, as part of the last post we dove into monitoring. We saw how tools such as Prometheus & Grafana can be used to have a birds-eye view of your application. We also found that monitoring on its own is not enough when we want to dig deeper into the issues that we notice through monitoring. We got introduced to the second pillar of observability ecosystem which is tracing. Tracing corresponds to individual request instead of application as a whole. In this post we will dive into use cases of tracing & also go through a demo by extending the service which we saw in the previous post(Find checkpoint code from previous post here).
Re-visiting the challenge
We are working with a booking-service that performs just one operation i.e. reserve a booking. In order to do so, it performs two internal operations:
- Call an external API to get a booking id
- Persist a booking record in a database
This time we have actually made changes in our application by introducing a booking-id-service which also performs 2 different operations i.e. same as what booking-service was doing initially. Now booking-service calls booking-id-service to get the booking id.
NOTE: This overly complex architecture is built to see our observability stack in our application.

The challenge we faced was how do we actually examine an issue such as increased latency if we just have monitoring setup for our application. We can say that the latency bump is coming from the external service for a set of requests. But what next? How do we continue trouble-shooting further? How do we connect a request leaving our system & getting processed by another service?
For eg if a support person comes to you with a set of requests for a particular tenant which is facing increased latencies, how can you figure out what is leading to this? With monitoring you can point finger towards the booking-id-service but that doesn’t solves the problem. As now you have to find some way to connect a request across both the services & see exactly which operation is contributing to latency increase.
This is where having tracing to connect a request across your service ecosystem helps you in figuring out the actual root cause for an issue. Let us see how can we use open-source tools to achieve this. To learn more about the primitives of tracing, please read Observability: A Primer
Setting up tracing
Just like we used Prometheus to collect metrics & Grafana to visualize those metrics in our monitoring setup, we will use similar open-source tools for our tracing setup. Two very well known tools for tracing are Jaeger & Zipkin. Both have excellent support in various mainstream programming language & integrate seamlessly with OpenTelemetry. We are going to integrate both of these tools in our application & see how they can help us visualizing a request path across our service ecosystem.
Our SpringBoot application doesn’t need to change much in order to leverage new tracing tools from our observability stack & one of the main reason for this is OpenTelemetry. We just update the service config to send traces to OpenTelemetry as we were earlier doing for monitoring using micrometer libraries. OpenTelemetry on its end exports these traces to both Jaeger & Zipkin. You can view all the code for setting up tracing in this code repository.
Our application doesn’t even need to know if we are using Jaeger & Zipkin. We can choose to use both of them or either of them. We can even choose to use neither of them & use some other tool that has integration with OpenTelemetry. Our application is only concerned about sending traces to OpenTelemetry & we can enjoy the flexibility of experimenting with various distributed tracing tools. To learn more about OpenTelemetry, please read Observability: OpenTelemetry – Decoupled by design.

Tracing in action
Now that we have setup our observability stack with tracing tools, its time to see this in action. We first start our observability infra for our application. Next we spin up both of our SpringBoot microservices & hit the endpoint to create few bookings.
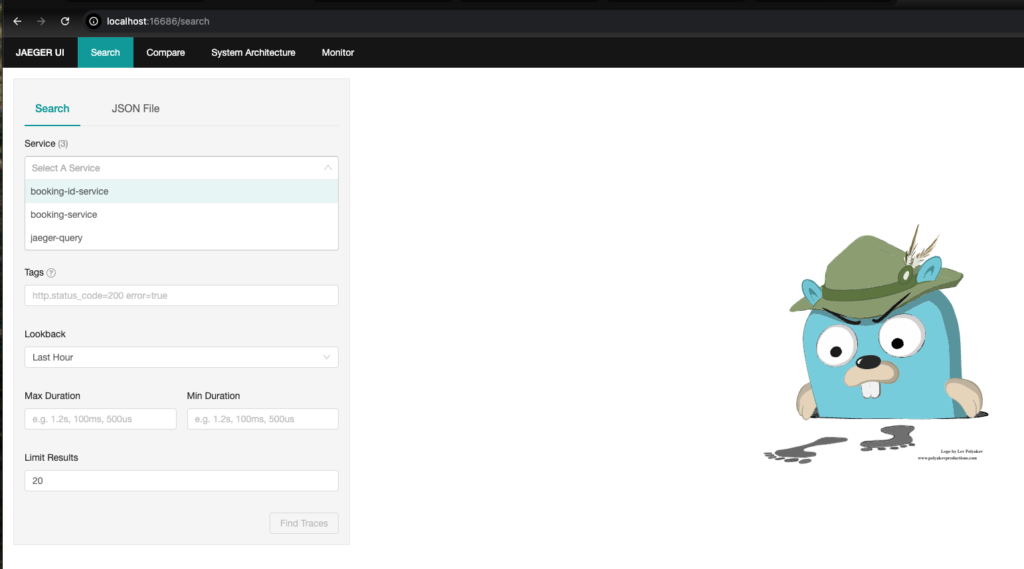
While running locally, you will be able to access Zipkin on http://localhost:9411 & Jaeger on http://localhost:16686. We see traces for our requests in both Zipkin & Jaeger.
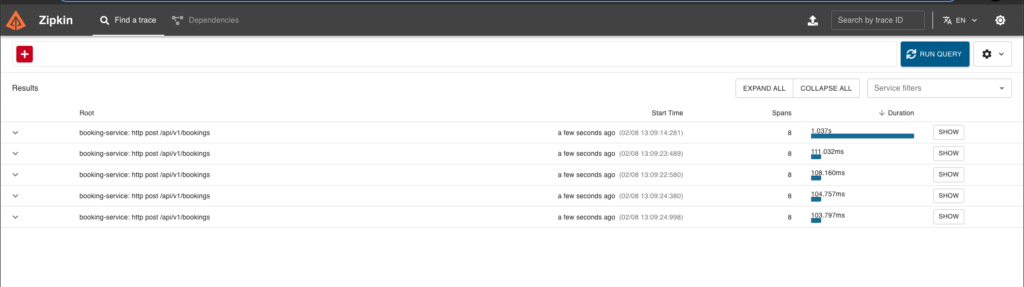
Next we can query these traces to see how they look across both the services. In Zipkin we can see that for a single request, we have individual breakdown for each operation across both the booking-service as well as in booking-id-service

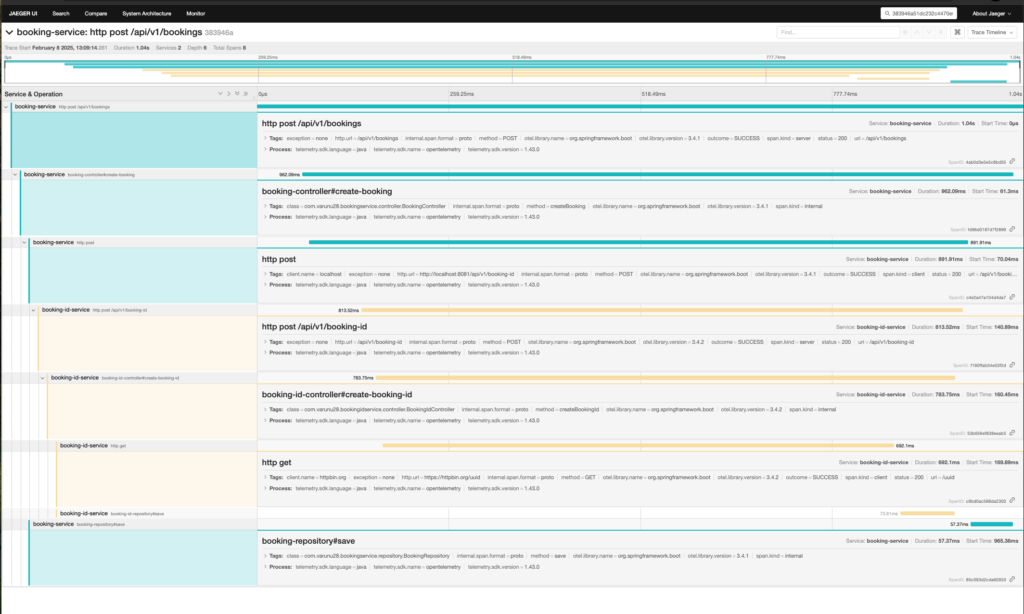
We pick up the TraceId of this request from Zipkin & use it to query it in Jaeger. We can see bunch of useful data such as how the request travels in our codebase, what operations are done in parallel, what are the individual latencies of each operation etc. With such granular data, we can confidently narrow down on the actual operation that is causing a spike in latency for our system.
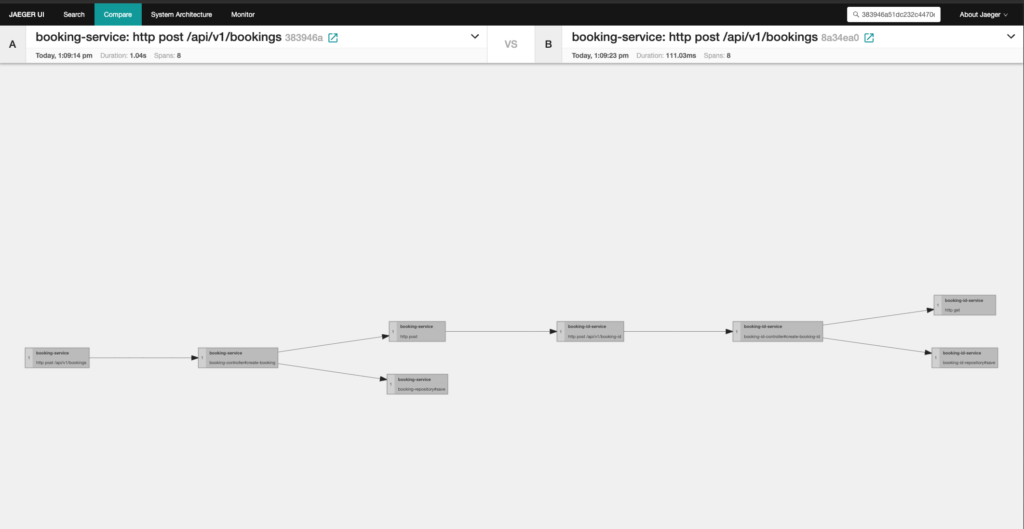
You can use Jaeger to compare traces & see how does a request under investigation compares to a request that got processed as expected. This way you can easily figure out the anomaly that happened in request processing.
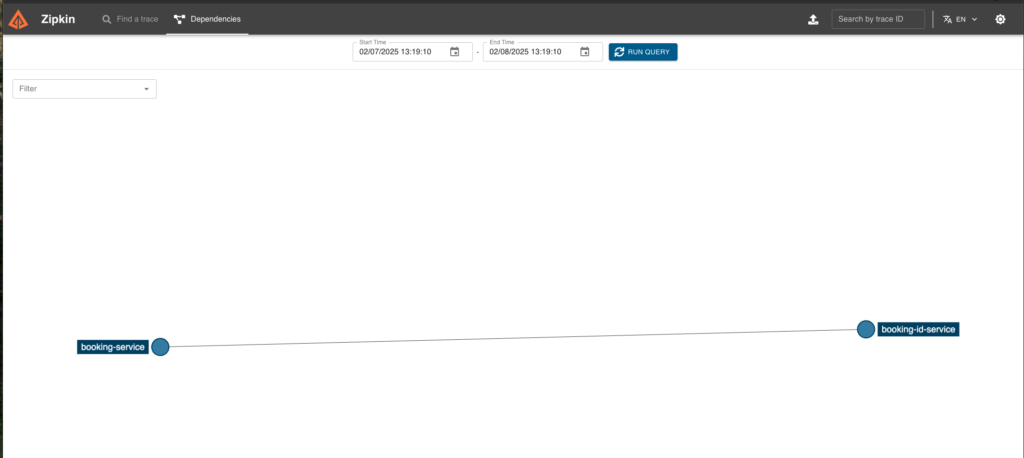
Whereas Zipkin shows you the dependency graph of all the requests in your application which can be helpful in understanding the request path in a complex microservice archicture.
Conclusion
Tracing tools such as Jaeger & Zipkin are industry standard tools that provide you with a ton of capabilities to reason about the requests your application are processing. As I pointed out in the last post that both tracing & monitoring solve different set of problems & therefore a good observability stack should have both the components. This will allow the developers to have all the information & they will be more confident while troubleshooting an issue at 3 AM during their on-call rotation.
Hope this mini-series on observability was helpful for you. Next I am planning to start diving into common patterns for cloud native applications & explore open source tools that help us in implementing those patterns. Till that time happy learning.